Most important Satsang Clips | Sant Rampal Ji Maharaj | Satlok Ashram | ...

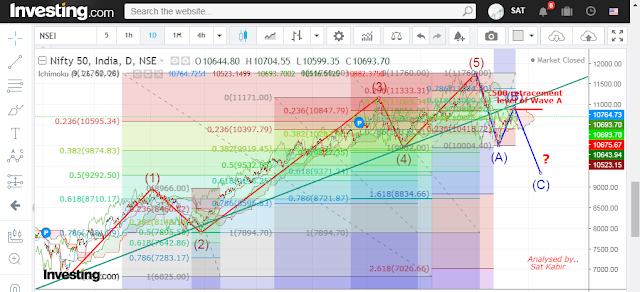
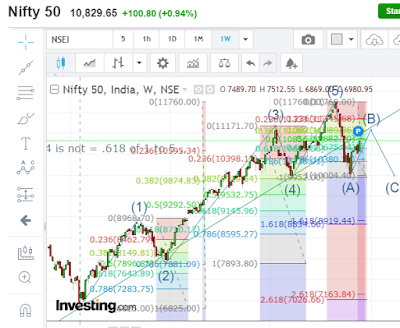
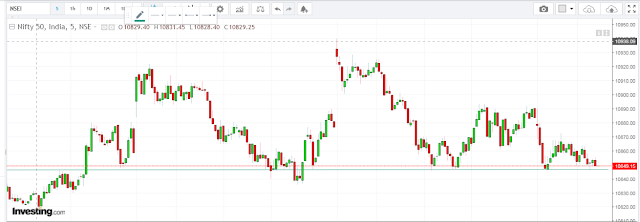
Disclaimer: This is Nifty 50 trading strategy as per our analytical point of view and is subjected to change due to global market situation, sentiment and fundamental analysis. Investment and trading in index and equities has its own risk. This material is solely for educational purpose and the authors or anybody associated in this analysis are not responsible for any profit or loss incurred to anybody based upon the technical analysis provided by us.